Measuring Marketing Campaign Effectiveness
Discover how to master measuring marketing campaign effectiveness. Learn to track the right metrics, use the best tools, and turn data into real marketing ROI.
Posted by
So, you're running a marketing campaign. How do you actually know if it's working?
The real key is moving beyond just spending money and hoping for the best. It's about creating a repeatable cycle: set clear goals, pick the right metrics to track, use the right tools to analyze what's happening, and then—this is the most important part—use that information to make your next campaign even better.
This is how marketing stops being a line item on an expense report and starts becoming a predictable, data-backed engine for growth.
Why Measuring Campaign Effectiveness Matters
Let's be honest, the big question is always, "How do we prove this marketing budget is actually doing something?" Answering that question is about more than just justifying your spend; it's a huge strategic advantage.
When you have a solid framework for measurement, you can confidently explain your budget, tweak strategies in the middle of a campaign, and tie every single marketing action back to what the business actually cares about. Without it, you're just guessing where your money is making a difference.
This kind of clarity is critical, especially as marketing gets more complicated and more expensive. For decades, proving a return on investment (ROI) has been the name of the game. Now, with the global digital ad market expected to hit $786 billion by 2026, the stakes are insanely high. Digital channels are king, making up about 72.7% of all ad spending—a huge leap from just 50% back in 2018. That means data-driven proof isn't just nice to have; it's non-negotiable.
From Cost Center to Revenue Engine
Good measurement completely changes how the rest of the company sees marketing. You shift from being a "cost center" to a well-oiled machine that predictably drives revenue.
This shift happens the moment you can draw a straight line from a specific marketing activity to a result on the bottom line. Want to get a better handle on this? It’s worth reading up on how to measure advertising effectiveness.
"Measuring success and allocating budget are two sides of the same coin. In order to make wise budget allocation decisions, we must understand which efforts have been successful and which have not."
When you're tracking things properly, every dollar has a story. You can point to which channels bring in the best leads, which ad creative gets the most love from your audience, and where your next big growth opportunity is hiding. If you're looking to build a solid foundation, our guide on how to measure marketing ROI is the perfect place to start.
Ultimately, a strong measurement framework gives you the power to:
- Justify Marketing Spend: Give stakeholders the hard data that shows exactly what their investment got them.
- Optimize in Real-Time: Spot what’s not working early, and move that budget over to what is. This is how you maximize every dollar.
- Improve Future Campaigns: Use what you learned from past campaigns to build smarter, more effective strategies right from the start.
Translating Business Goals Into Actionable KPIs

Before you ever look at a dashboard, you need to ask one simple question: what does success actually look like for this campaign? So many campaigns fail because they start with vague goals like "increase brand awareness," which are impossible to measure and lead straight to wasted effort.
The real trick is to translate those high-level business objectives into specific, trackable marketing Key Performance Indicators (KPIs). This isn't just marketing jargon; it's a process that forces you to define exactly what you want to achieve, giving your team a clear target to hit.
Ditching Vanity Metrics for Actionable Insights
One of the biggest traps marketers fall into is chasing vanity metrics. These are the numbers that look great in a report but tell you absolutely nothing about the campaign's impact on the business. I'm talking about things like total follower count or post impressions. Sure, they feel good, but they don't connect to revenue.
Actionable metrics, on the other hand, tell a story. They’re the KPIs that directly reflect how marketing is moving the needle. A B2B company, for instance, shouldn't just be tracking impressions on a new whitepaper. Instead, they should be laser-focused on the number of marketing qualified leads (MQLs) it generated. That’s a number that tells you something real.
The most effective KPIs are those that bridge the gap between marketing activity and business results. If you can't draw a line from your metric to a business objective, it's likely a vanity metric.
Let's break down how this works for different goals:
- Brand Awareness: Forget raw impressions. Instead, track your share of voice (how often your brand is mentioned vs. competitors) and your audience engagement rate (likes, shares, and comments as a percentage of your audience).
- Lead Generation: Don't stop at form fills. You need to know the conversion rate of your landing pages, your cost per lead (CPL), and, most critically, the lead-to-customer rate. This last one tells you if you're bringing in quality leads or just noise.
- Direct Sales: This is where the rubber meets the road. Your go-to KPIs here should be Return on Ad Spend (ROAS) and Customer Acquisition Cost (CAC).
Getting a handle on these costs is non-negotiable. For a more detailed breakdown, our guide on customer acquisition cost calculation is a great place to start.
Matching KPIs to Campaign Objectives
Here’s the thing: there's no magic, one-size-fits-all list of KPIs. The right metrics depend entirely on your campaign's primary goal. A campaign designed to drive e-commerce sales will look completely different from one built to grow an email list.
Let's walk through a real-world scenario. Imagine you're a SaaS company launching a new feature. Your main business goal is to get current customers to actually use it.
- Business Goal: Increase new feature adoption by 25% in Q3.
- Marketing Campaign: A series of emails and in-app notifications targeting existing users.
So, what are the right KPIs here?
- Email Click-Through Rate (CTR): This tells you if your announcement was interesting enough for users to even click.
- In-App Notification Engagement: How many people are tapping the notification to explore the new feature?
- Feature Adoption Rate: This is the big one. What percentage of your targeted users are actively using the feature? This is your ultimate success metric.
- User Session Duration (on the new feature page): This adds crucial context. Are people just clicking and immediately leaving, or are they genuinely exploring what you've built?
By choosing these specific KPIs, the marketing team can draw a straight line from their work to the big-picture business goal. That's what measuring marketing campaign effectiveness is all about—making your impact undeniable.
Building Your Marketing Measurement Tech Stack
Picking the right KPIs is half the battle. The other half? Having the right tools to actually track them without drowning in spreadsheets. A solid, well-connected tech stack is what pulls all your data together, giving you a single source of truth so you can start connecting dots you didn't even know existed.
The goal isn't just to hoard data from different platforms. It’s about creating a seamless flow of information that tells a story.
Think about a typical B2B customer journey. It might start with a click on a LinkedIn ad, which leads to a landing page conversion. That lead gets logged in your CRM, like HubSpot, and eventually, the sales team closes the deal. Without an integrated stack, each of those touchpoints is just an isolated data point, making it almost impossible to trace that final sale all the way back to the initial ad.
Core Components of a Measurement Stack
While everyone's stack will look a little different, the most effective ones are usually built on three key pillars. Each one plays a unique role in tracking a customer from their very first interaction to the moment they convert.
- Web and App Analytics Platforms: This is your home base for understanding what people do on your site or app. Tools like Google Analytics 4 (GA4) are non-negotiable for tracking traffic, session duration, bounce rates, and key conversion events. It’s how you answer the fundamental question: "What happens after they click?"
- Customer Relationship Management (CRM) Systems: This is where all your customer data lives. Platforms like Salesforce or HubSpot are critical for connecting marketing efforts to actual sales. By tracking leads as they move through the pipeline, a CRM helps you measure lead quality and, ultimately, customer lifetime value.
- Channel-Specific Analytics Tools: Every marketing channel has its own quirks and metrics. You’ll need to get comfortable with the native dashboards—think Meta Business Suite or LinkedIn Analytics—to really dig into engagement rates and audience demographics. If you need help picking the right ones, our deep dive into the best social media analytics tools can point you in the right direction.
This infographic really nails how the data consolidation process should work.
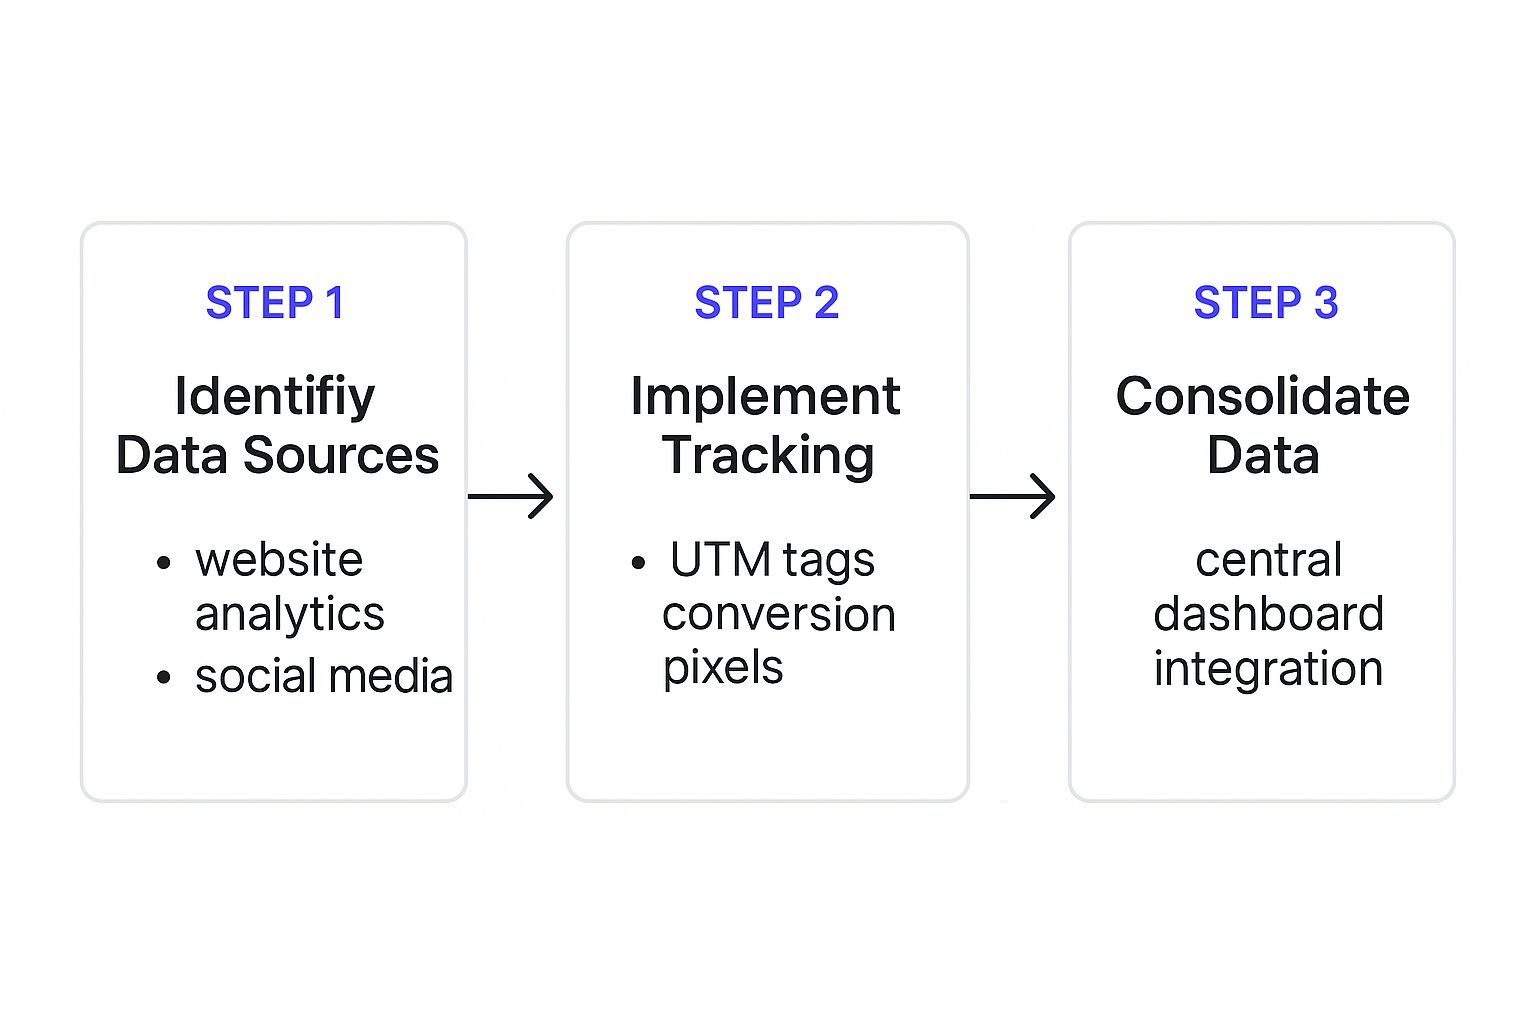
Moving from identifying different sources to consolidating the data is what creates that unified, big-picture view of your campaign performance.
Simplifying ROI With Specialized Calculators
Even with powerful CRMs and analytics platforms, directly tying campaign spend to revenue can get complicated. This is where specialized tools can step in to make your life a whole lot easier when it comes to measuring marketing campaign effectiveness.
A dedicated ROI calculator, for instance, can bridge that final gap between what you spent and what you earned.
For instance, our own EndorseFlow ROI calculator is built to help you visualize the potential returns from testimonial and social proof campaigns before you even launch them.
This kind of tool lets you plug in your specific costs and conversion estimates to get a clear, immediate projection of your potential return on investment.
And it’s not just about calculators. The integration of AI into analytics is a game-changer. Today, a staggering 88% of marketers are using AI in their campaigns, and 83% say it’s made them more efficient. AI is helping some brands achieve up to 10% faster revenue growth through things like real-time social listening and sentiment analysis. It’s not a futuristic nice-to-have anymore; it's a practical advantage.
Your tech stack's real job is to tell a complete story. It needs to connect every dollar you spend to a specific user action and, ultimately, to the revenue it helps generate.
From Raw Data to Actionable Insights

Let's be honest, collecting data is the easy part. The real work begins when you have to turn a spreadsheet full of numbers into a clear story about what’s actually working.
So many marketers get stuck here. They glance at a top-level report, see the numbers, but never dig in to find the "why" behind them. But those "why" moments are where real growth happens. It all starts with making sure your data is clean from the get-go.
And that brings us to UTM parameters. They’re not glamorous, but they are absolutely foundational. These are just simple tags you add to your URLs that tell your analytics tools exactly where every click came from. Consistently using them is the difference between knowing "we got some traffic from social media" and knowing "that specific Instagram Story drove 50 qualified leads."
Look Beyond the Obvious Numbers
Once your data is clean, you can graduate from just reporting numbers to actually asking what they mean.
A high bounce rate on a landing page isn't just a metric; it's a warning sign. It’s your audience telling you something is off. Maybe the ad creative set the wrong expectation. Maybe the page is painfully slow to load. This is the heart of measuring marketing campaign effectiveness—connecting the dots between the numbers and the real human experience.
To get there, you need to build comprehensive metrics and reporting practices that give your numbers context. That context is what turns a simple stat into a clear directive for what to do next.
The goal isn't just to report what happened, but to build a narrative that explains why it happened. That narrative becomes the blueprint for your next campaign.
Think about user-generated content (UGC) campaigns. The data here tells a powerful story. We know UGC drives 28% more engagement than standard branded posts and gets click-through rates four times higher. Why? Because people, especially Gen Z and Millennials, see it as 2.4 times more authentic than a polished ad.
Tell Your Campaign's Story with a Dashboard
One of the best ways to make sense of all this is to create a simple campaign dashboard. This doesn't need to be some complex, over-engineered system. It can be a custom report in Google Analytics or even a well-organized spreadsheet. The point is to visualize your most important KPIs in one place.
Let's imagine you're running a dashboard for an e-commerce product launch. Instead of a cluttered report with dozens of metrics, you’d zero in on the essentials:
- Cost Per Acquisition (CPA): Are we on budget for each new customer?
- Conversion Rate by Channel: Where are our actual buyers coming from?
- Add-to-Cart Rate: Are people interested but getting stuck before checkout?
- Return on Ad Spend (ROAS): Simple enough—is this campaign making money?
By seeing these key numbers side-by-side, you can spot problems instantly. If your social media ads have a fantastic add-to-cart rate but a terrible final conversion rate, that’s a huge insight. It tells you to stop tinkering with the ad creative and start investigating your checkout process for friction.
That's how raw data stops being intimidating and starts becoming your most powerful tool for making smart decisions.
Right, so you've crunched the numbers and pulled out some insights. Now what?
Measurement without action is just an academic exercise. This is where you close the loop—turning those carefully gathered insights into real-world improvements that actually move the needle. It's all about building a feedback loop where your campaign data directly informs every single strategic move you make next.
This completely changes how you approach new campaigns. Instead of starting from scratch and throwing spaghetti at the wall, you begin with a solid foundation of what you already know works. The goal is to stop guessing and start making systematic, incremental gains that compound over time.
Systematically Testing for Growth
One of the most powerful ways to optimize is through disciplined A/B testing. This isn't about trying out random ideas to see what sticks; it's a methodical approach to finding out what truly resonates with your audience. You can test just about anything, but for the biggest bang for your buck, focus on elements with the most potential impact.
Start with your highest-traffic assets and biggest opportunities:
- Ad Copy: Test different headlines or calls-to-action. Does "Shop Now" work better than "Learn More"? You'd be surprised what a small tweak can do for your click-through rate.
- Landing Pages: Experiment with button colors, form lengths, or the core value proposition. Sometimes a shorter form can double your conversion rate overnight.
- Offers: Pit a free trial against a product demo. Which one generates not just more leads, but more qualified leads?
The golden rule of A/B testing is to change only one variable at a time. If you change the headline and the button color, you'll have no idea which one caused the lift. Keep it clean, and you'll get data you can actually use.
Doubling Down on What Works
Your analysis will almost always show you a few rockstar channels and a few duds that are barely pulling their weight. This is where strategic budget reallocation comes in. It’s a simple concept, but it's incredibly effective: shift your spend away from underperforming channels and double down on the ones driving real results.
If your data shows that LinkedIn ads are bringing in high-value leads at a low cost-per-acquisition while your display ads are just burning cash, the decision is pretty clear. Don't be afraid to make bold moves based on what the numbers are telling you. This agile approach is fundamental to measuring marketing campaign effectiveness and maximizing every dollar of your budget.
Let’s say a local retailer is digging into their Google Ads data and finds that searches including "near me" generate the most valuable in-store visits. This makes sense—local digital marketing is a huge deal, as 97% of consumers now search online for local businesses. In fact, these local-intent searches, which have surged by 500% recently, drive 1.5 billion physical location visits each month and now account for a whopping 46% of all Google searches. You can learn more about how consumers find local businesses in this detailed digital marketing report.
Armed with that insight, the retailer can immediately optimize their campaign to capture more of this local intent. They could reallocate their budget to bid more aggressively on those "near me" keywords. The result? A direct, measurable increase in foot traffic, proving the undeniable value of their data-driven optimization.
A Few Common Questions
 Even with a solid plan, getting into the weeds of marketing analytics can bring up some practical challenges. Let's tackle some of the most common questions that pop up when you start measuring what really matters.
How Do You Measure Brand Awareness Campaigns?
This is a big one. When a campaign's goal isn't a direct sale, you have to shift your thinking. You're not looking for immediate conversions, so you need to track indicators of reach and perception instead.
Forget sales for a moment and focus on these metrics:
- Share of Voice (SOV): How often is your brand being talked about online compared to your competitors? If this number is climbing, your presence is growing. It's as simple as that.
- Social Media Engagement: Don't just count impressions. Look at the likes, comments, and shares. This tells you if people are actually connecting with your content, not just scrolling past it.
- Direct Website Traffic: This is a fantastic signal. When people type your URL straight into their browser, it means they remember you. That's brand recall in action.
The whole point is to prove your campaign is making a real impression, building an audience that will turn to you when they're ready to buy.
The value of a brand awareness campaign is long-term. You're building an audience that will trust you later, so measure the growth of that audience and their connection to your brand.
What If We Have No Tracking Infrastructure?
Starting from a blank slate can feel overwhelming, but look at it this way: you get to build a clean, effective measurement system from the ground up. The key is not to boil the ocean.
Start with the absolute must-haves. First thing's first: get Google Analytics 4 (GA4) on your website. It’s free, it’s powerful, and it will immediately start gathering essential data on where your traffic is coming from and what people are doing.
Once GA4 is up and running, add one more layer. Start using UTM parameters for every single marketing link you put out there. This simple habit lets you see exactly which campaigns, ads, or posts are driving traffic and conversions right inside GA4. It gives you immediate clarity without needing a complex, expensive tech stack.
Which Attribution Model Is Best?
Sorry to disappoint, but there’s no single "best" model for everyone. The right one really depends on your customer's journey.
Most people start with Last-Touch, which gives 100% of the credit to the final touchpoint before a conversion. It's simple, sure, but it's also blind to all the earlier interactions that warmed up the lead.
For a more complete picture, most businesses are better off with a Position-Based or Time-Decay model. A Position-Based model credits the first and last interactions, while Time-Decay gives more weight to the touchpoints closest to the conversion. My advice? Play around with the different models in your analytics tool. See which one paints a picture that actually reflects how your customers find and engage with you.
Ready to turn customer trust into measurable growth? EndorseFlow makes it simple to collect powerful testimonials and manage your social proof all in one place. Stop guessing and start seeing the real ROI of your customer voice.